This blog runs on Github pages which means I don’t have access to the backend which in turn means I can’t use one of the A/B testing libraries. I know google analytics (GA) has a feature to run A/B experiments.
The objective
I deliberately hide my contact details on my resume. The interested visitor who lands on my resume page (a lead) may want to know my contact details by clicking on a button (the conversion). The objective is to know the optimum style for the button to deliver maximum conversions.
Presentation of alternatives
First of all, GA bases the experiments on URLs to identify an alternative so I had to insert this javascript code into my resume page to change the button style based on values in the hash param (#) of the url. Adding another alternative to the experiment is just a matter of changing hash param now.
<div id="contact_details">
    <button type="button">Fetch my contact details</button>
</div>$(function(){
if (location.hash.length !== 0) {
query_params = location.hash.split('#')[1];
exp_values = {};
$.each(query_params.split('&'), function (indx, value) {
key = value.split('=')[0];
value = value.split('=')[1];
if ( parseInt(value) > 0 ) {
exp_values[key] = "#" + value; // hex color code
} else {
exp_values[key] = value;
}
});
$("#contact_details>button").css({
"color": exp_values.color,
"background": exp_values.background
});
}
});Recording the conversion
On click of the button an ajax call is made to fetch a small piece of html containing my details. Simultaneously, I also record the event as a goal in GA. We could record the conversion on ‘succesful’ fetch of details. But,in my opinion, the button’s job is only to generate a click and not necessarily waiting till a succesful data load.
$(function(){
    $("#contact_details>button").click(function(){
        $.get("/contact_details.html", function (resp) {
            $("#contact_details").html(resp);
        });
    });
    $("#contact_details>button").click(function(){
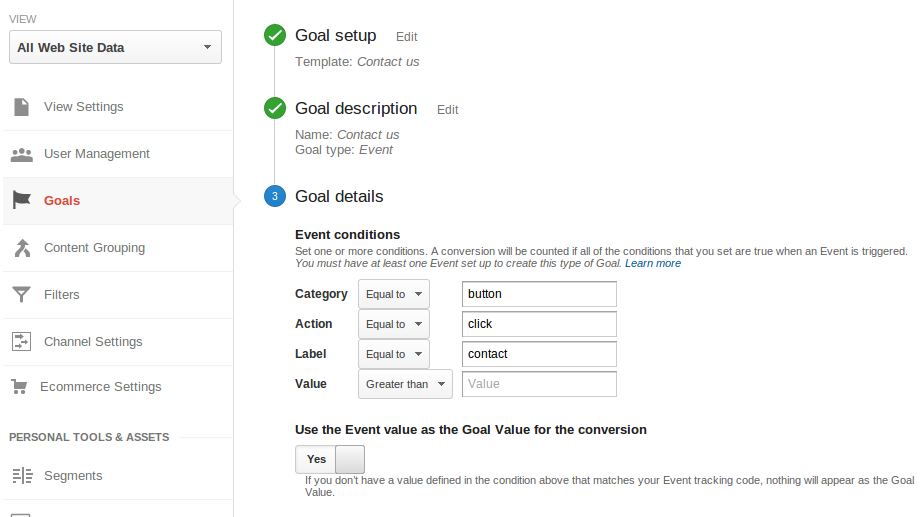
        ga('send', 'event', 'button', 'click', 'contact');
    });
});
Setting up the goal on GA
-
Creating the goal
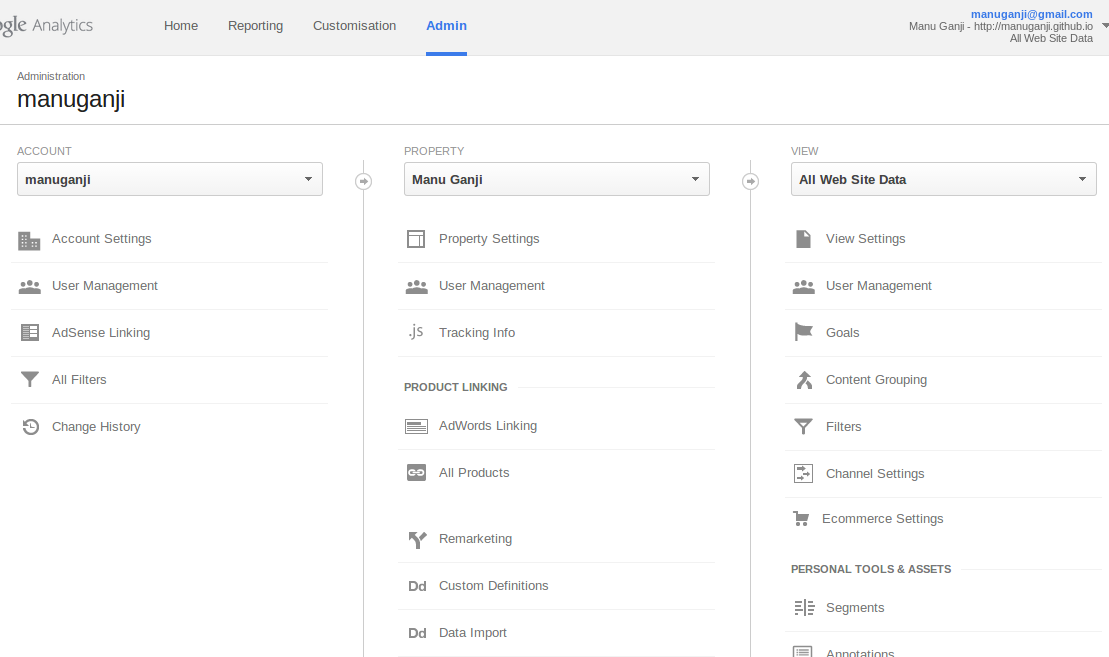
Go to the admin tab in google analytics and click on “Goals” under the column “All web site data”.

Once inside, click on “+Goal” button and finish the steps like shown below. I’m using the default values for most of the settings. The default values work for the event recording code above.

-
Creating the experiment
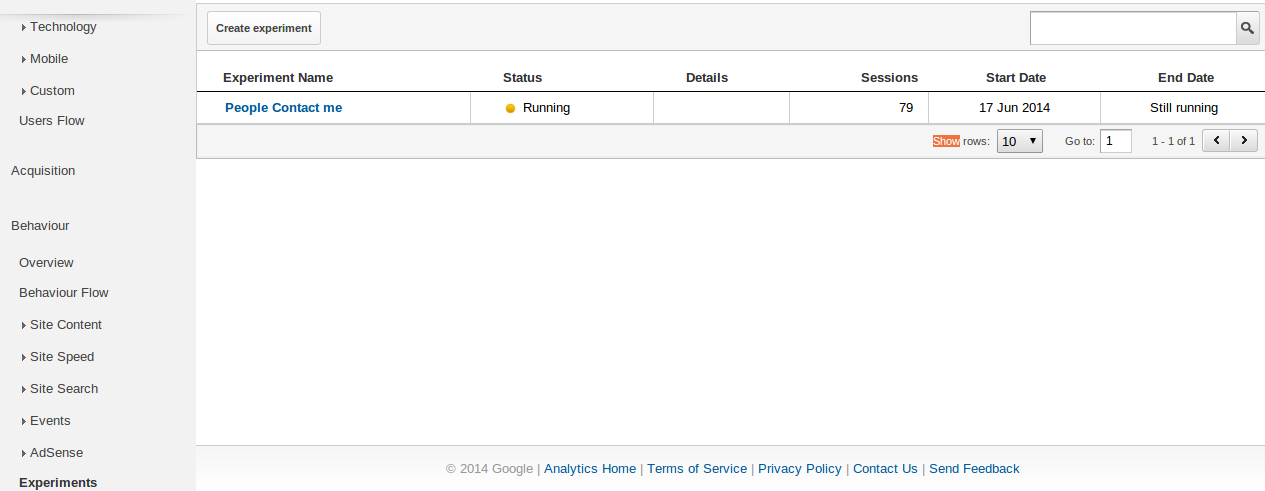
Navigate to experiments section under “Behaviour”
 Create an experiment and use the goal we created above as the objective of the experiment.
Once inside follow the help section (click on the “academic hat” icon on the top right to see it) to create the experiment. You can make the urls for the alternatives like so:
<original_page_url>#color=red&background=white
for example, in my case the original page is at http://manuganji.github.io/resume.html so the variants are like the following
- http://manuganji.github.io/resume.html#color=red&background=white
- http://manuganji.github.io/resume.html#color=black&background=yellow
Results
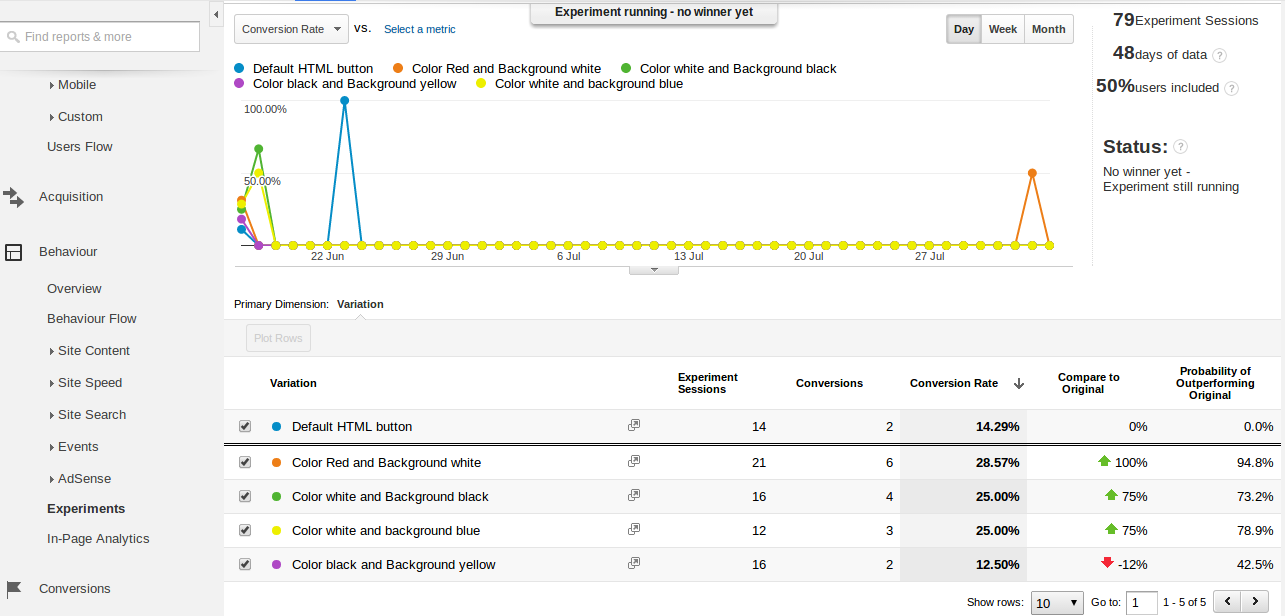
It takes about a day for you to see the goal stats to start appearing on the experiment page.

After finishing this, I could see sense in a paid service like Optimizely. It shouldn’t be so hard to do simple color experiments like this. And I heard that Optimizely people were formerly google analytics team members and they started up just to address how hard this is. By the way, could you please participate in my experiment and help me take my results to statistically significant values? :-P